Gaussian Splatting on a Jetson Nano: the bottleneck wasn’t the sort
The sort looks like the slow part. Gaussian Splatting blends splats front to back inside each screen tile, and that per-tile sort has a reputation for eating the frame. Put the renderer on a 2019 Jetson Nano, 128 Maxwell cores against a 25.6 GB/s memory bus, and the bottleneck should be that sort or the memory wall.
It was neither. The profiler said so twice, then a third time about the fix.
This follows How Gaussian Splatting Renders. That post covered how splatting turns 3D Gaussians into pixels without ever calling a network. This one takes the same forward pass, stripped to inference and ported in part one, and times it on a board that costs less than a game. Rendering was the easy half. Finding what made it slow was the work.
The board sets the rules
Maxwell, compute capability 5.3, no Tensor cores, 25.6 GB/s of memory bandwidth. That last number sets the trap. Splatting reads a lot of per-Gaussian data per pixel, so the reflex is “you’re bandwidth-bound, reach for half precision.” Hold that thought.
A scene with a dial on it
A real capture gives you one data point and a pile of confounds. A synthetic scene gives you a knob. So the renderer gets fed Gaussians spread through the view frustum, filling the screen at every depth, with random orientation and opacity, and one parameter sets the count.
That knob makes splat count a controlled variable. Ask what breaks first as the scene gets denser and the answer comes back clean. The scene is deliberately heavy. Every splat lands on about 13 tiles, so each tile blends hundreds of overlapping Gaussians. A stress test, not a postcard.
The sort isn’t it
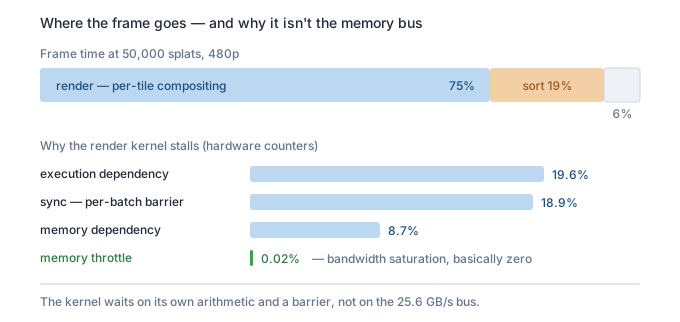
Stage timing, cross-checked against the CUDA profiler, at 50,000 splats and 480p:
render (per-tile compositing)   75%
radix sort                      19%
everything else                  6%
The sort runs second, and a distant second. The frame goes to the render step, the per-tile alpha compositing that walks each pixel’s sorted list and blends. The starting guess was sort or tile-binning atomics. The atomics come in under 12%.
The sweep hides a nice detail. Render time barely moves as splats pile up, holding near 53 ms from 50,000 Gaussians to 500,000. The compositing loop stops a pixel the moment it goes opaque, so once a tile is dense enough to saturate every pixel, more Gaussians add no work. Render is bound by coverage and overlap, not by raw count. The sort grows straight in line with the work and takes the lead only above roughly 200,000 splats.
The memory wall isn’t it either
So render dominates. The reflex says it is starved on that 25.6 GB/s bus, and half precision buys it back. That was almost the plan.
The hardware counters say otherwise, and on a Jetson they need root to read. The stall reasons for the render kernel:
stall_exec_dependency   19.6%   waiting on a previous instruction's result
stall_sync              18.9%   waiting at the per-batch barrier
stall_memory_dependency  8.7%
stall_memory_throttle    0.02%  bandwidth saturation
Bandwidth throttle is two hundredths of a percent. The kernel does not wait on the bus. Occupancy sits at 98% and the cores are busy 99% of the time, busy on each other’s arithmetic and on a barrier. I had the half-precision patch half-written by then. It died there, a day unspent.
One counter tried to mislead. “DRAM utilization” pegged at maximum, which reads like a smoking gun for bandwidth. It is contradicted by the throttle number and by the real throughput, about 1 GB/s against a 25.6 GB/s ceiling. On Tegra’s shared memory that utilization figure is unreliable. Trust the stall breakdown.
The exp that wasn’t a double
A kernel waiting on its own arithmetic points at the arithmetic. The compositing inner loop is short: compute the Gaussian falloff, turn it into an alpha, fold it into the running color and transmittance. The one expensive-looking call is the exponential.
The suspect was double precision. exp(power) on a float can promote to a double exp, and Maxwell runs doubles at about a thirty-second of the float rate. A disaster worth fixing. So disassemble and look.
It was already a single-precision MUFU.EX2, the hardware exp on the special-function unit. No double anywhere in the hot loop. The guess was wrong again.
One detail saved it. The standard expf wraps that instruction in argument reduction and range handling, and the wrapper is real work on the critical path, because the exp result feeds the next blend, which feeds the next. The fast intrinsic drops the wrapper:
// __expf keeps the same MUFU.EX2 but drops expf's argument-reduction wrapper.
// power is small and negative here, so the accuracy cost is negligible.
float alpha = min(0.99f, con_o.w * __expf(power));
One line. Render fell from 53.0 to 45.7 ms, about 14%. Frame rate at 25,000 splats went 17.5 to 20.2, and at 50,000 it crossed 14.0 to 15.6, from below the target band into it.
The accuracy needed checking, since a few hundred blends stack on each pixel. Render the same dense scene both ways, standard exp and fast, then compare every pixel: three bytes out of 921,600 differ, each by one step out of 255. The image is the same image.
The profiler after the change is honest. The kernel is still dependency-bound and sync-bound, in the same proportions. __expf did not change what limits the kernel. It removed work from the limit, which is a smaller and truer claim than finding the bottleneck.
Where that leaves the kernel
Three corrections in, the render kernel sits near its floor for the algorithm it runs. Front-to-back compositing is serial, each blend waiting on the last. The per-tile barrier makes the fast pixels wait on the slow ones. Half precision does nothing here. A faster exp helped because it was cheap and shortened a serial chain, and there is no second __expf to find.
The lever that remains points upstream. Render is bound by overlap, by how many splats crowd each tile, so the way to speed it up is to carry fewer of them. That is pruning.
Measure before you reach for the obvious fix
Sort is slow. You’re bandwidth-bound. That call must be a double. Three reasonable guesses, three wrong on this hardware, and each one would have cost real work. The profiler caught the first two. The disassembler caught the one the profiler couldn’t.
The 14% was worth having. The habit that found it was worth more.
Next: pruning a room-scale scene down to something a 4GB board can hold, and what that does to the frame.
Real-time Gaussian Splatting on a $99 board
- Compiling a 2023 CUDA renderer for a 2015 GPU
- Gaussian Splatting on a Jetson Nano: the bottleneck wasn't the sort (this post)
- Most of a Gaussian scene is haze: pruning a real capture onto a $99 board
- I downloaded 120 KB of a 14 GB file to find the camera
- The same image on two GPUs a decade apart
- The backward pass I deleted trained the model the Nano runs
- The two machines coordinated through a markdown file
New parts publish weekly; this list grows as each one goes live.